BNZ – BusinessNZ
Performance of
Services Index

Wild weather dampens service sector activity for May – PSI

14 Jun, 2010

While the service sector experienced its seventh consecutive month of expansion, comments from businesses showed the weather played a role as activity softened slightly in May, according to the BNZ – BusinessNZ Performance of Services Index (PSI).

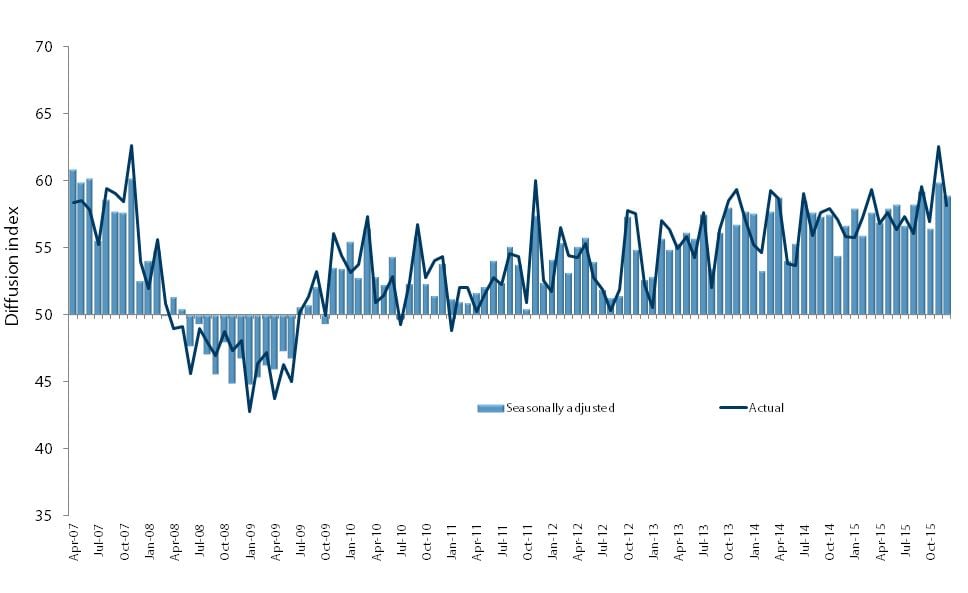
The PSI for May was 53.3. This was 0.6 points down from April, but up 5.2 points from May 2009. A PSI reading above 50.0 indicates that the service sector is generally expanding; below 50.0 that it is declining. The average PSI value for 2008 was 49.1, while for 2009 it was 48.8. So far, the average score for 2010 is 54.4.

BusinessNZ chief executive Phil O’Reilly said while March showed a significant boost in overall activity, the other six months of expansion since November had been fairly consistent. Any hope of stronger expansion in May after the dip in April was always going to be difficult given recent weather conditions.

“Weather is often a double edged sword for the service sector, as some businesses depend on fine weather while others enjoy better trading during winter. However, on balance the strong concentration of negative comments from respondents show the wild and wet conditions during May led to a less than ideal month for day-to-day activity for many.”

Bank of New Zealand Economist Doug Steel said May’s result had an air of growth consolidation. This was apparent as May’s results equalled the PSI average of the last seven months, he said.

“A growth consolidation theme is also consistent with the mix of results in the detail of May’s PSI. Sales have risen and new orders have fallen a little, but these indices are now close to each other, indicative of growth at a sustainable level.”

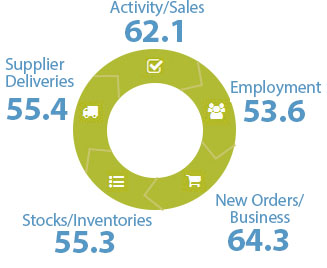
All five sub-indices were in expansion mode for the third consecutive month – the first time since late 2007. Encouragingly, activities/sales (55.0) rose 1.7 points from April, although new orders/business (55.7) dipped to its lowest value since October 2009. Employment (50.8) slipped 3.6 points from April to reach a similar level to February. Supplier deliveries (51.2) returned to a similar level experienced in January, while stocks/inventories (50.9) returned exactly to its March result.

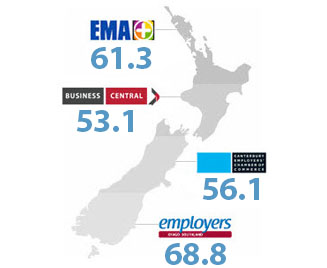
Unadjusted activity was positive in the North Island, but negative in the South Island. The Central region (54.9) again led the way, albeit with a lower score than in April. The Northern region (52.4) improved 1.6 points from April after a significant fall the previous month. Both South Island regions remained in contraction in May, with the Canterbury/Westland region (44.7) slipping further. The Otago/Southland (48.3) region was largely unchanged from April.

Click here to view the May PSI & PCI
Click here to view the PSI time series data
Click here to view the PCI time series data

For media comment: Doug Steel 04 474 6923 or Kathryn Asare 021 555 744.

BNZ - BusinessNZ PSI

Time Series Data

View seasonally adjusted and unadjusted time series data for the BNZ - BusinessNZ PSI

Services Landscape

Sponsor Statement

BNZ is delighted to be associated with the Performance of Services Index (PSI) and BusinessNZ.

This association brings together the significant experience of leading business advocacy body BusinessNZ, and business finance specialist BNZ.

We look forward to continuing our association with BusinessNZ and associated regional organisations, and to playing our part in the ongoing development of the New Zealand service sector.

PSI Time Series Table

The results are seasonally adjusted.

BNZ – BusinessNZ PSI Time Series

January 1966 – January 1970

International Results

J.P. Morgan Global Manufacturing PSITM

About the PSI

The BNZ – BusinessNZ Performance of Services Index is a monthly survey of the service sector providing an early indicator of activity levels.

A PSI reading above 50 points indicates service activity is expanding; below 50 indicates it is contracting.

The main PSI and sub-index results are seasonally adjusted.

Technical Contact

Stephen Summers
Economist, BusinessNZ

[email protected]

PSI Releases

Treading water

New Zealand’s services sector continued to display contraction for a sixth consecutive month, according to the BNZ – BusinessNZ Performance of Services Index (PSI). The PSI for July was 48.9 (A PSI reading above 50.0 indicates that the service sector is generally...

Ongoing contraction

New Zealand’s services sector displayed contraction for a fifth consecutive month, according to the BNZ – BusinessNZ Performance of Services Index (PSI). The PSI for June was 47.3 (A PSI reading above 50.0 indicates that the service sector is generally expanding;...

Service with a slump

New Zealand’s services sector continued to show further decline in activity during May, according to the BNZ – BusinessNZ Performance of Services Index (PSI). The PSI for May was 44.0 (A PSI reading above 50.0 indicates that the service sector is generally expanding;...

Declining fortunes

New Zealand’s services sector showed further decline in activity during April, according to the BNZ – BusinessNZ Performance of Services Index (PSI). The PSI for April was 48.5 (A PSI reading above 50.0 indicates that the service sector is generally expanding; below...

Continued softness

New Zealand’s services sector continued to show slight contraction during March, according to the BNZ – BusinessNZ Performance of Services Index (PSI). The PSI for March was 49.1 (A PSI reading above 50.0 indicates that the service sector is generally expanding; below...

BNZ – BusinessNZ
Performance of
Composite Index

PCI Time Series Table

The results are seasonally adjusted.

BNZ – BusinessNZ PCI Time Series

January 1966 – January 1970

About the PCI

The BNZ – BusinessNZ Performance of Composite Index (PCI) takes into account results from both the Performance of Manufacturing Index (PMI) and the Performance of Services Index (PSI). Combined results are shown in two ways:

GDP-Weighted Index:
Apportions the weight of the manufacturing and services index within the economy to produce an overall result.

Free-Weighted Index:
Combines data from both indexes to produce an overall result.

Both time series for the PCI are then seasonally adjusted.

BNZ - BusinessNZ PCI

Time Series Data

View seasonally adjusted and unadjusted time series data for the BNZ - BusinessNZ PCI

Our Contributors

The BNZ – BusinessNZ PSI contains data obtained through BusinessNZ’s regional organisations