BNZ – BusinessNZ
Performance of
Services Index

Service sector still in the shadows – PSI

15 Jun, 2009

The service sector remains in the shadows, but activity doesn’t appear to be getting any darker, according to the BNZ Capital – BusinessNZ Performance of Services Index (PSI).

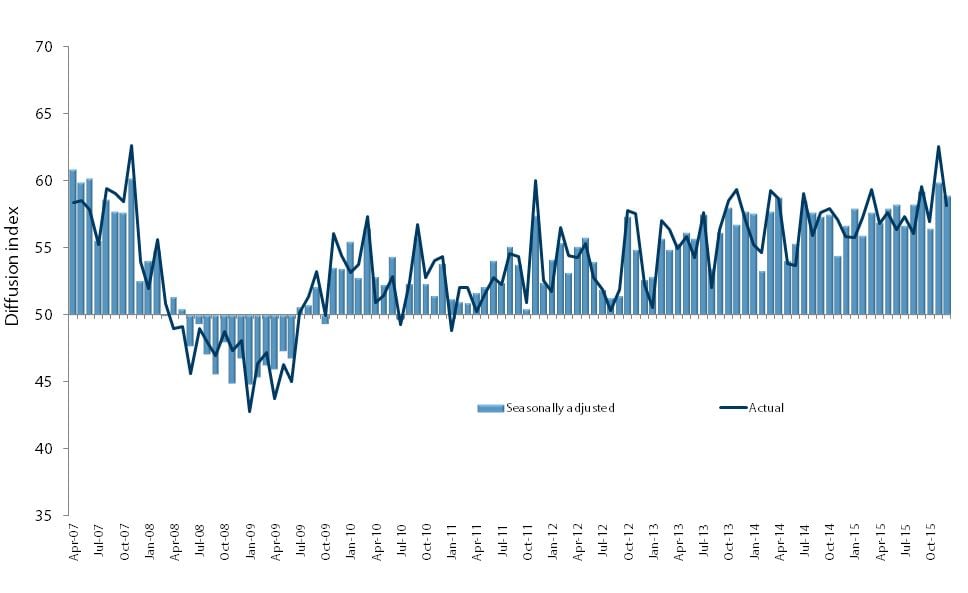
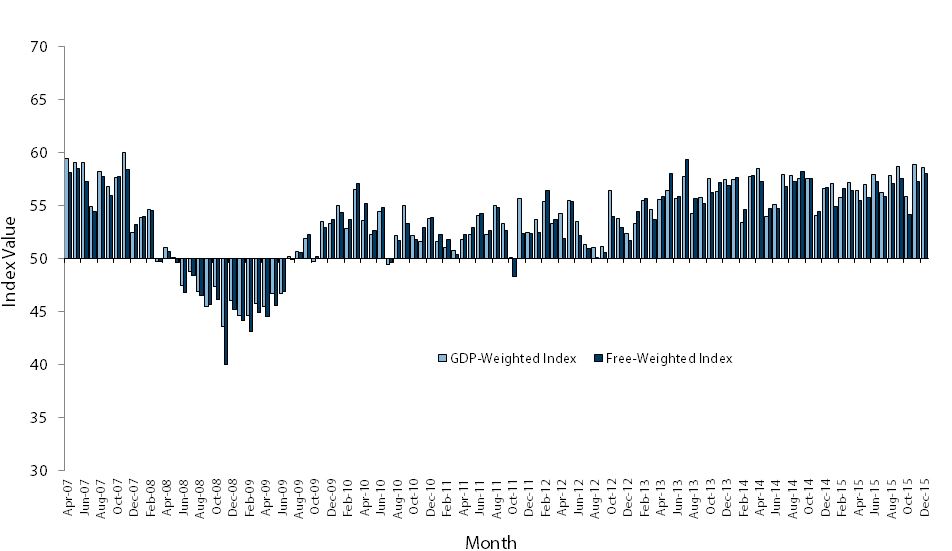
The PSI for May stood at 46.2, which was 2.5 points up from April, and almost identical to the February 2009 result. In comparison with previous years, the May result was 2.9 points down from May 2008, and 12.3 points down from 2007. A PSI reading above 50.0 indicates that the service sector is generally expanding; below 50.0 that it is declining. The average PSI value for 2007 was 58.1, while for 2008 it was 49.1. For the first five months of 2009, the average score has been 45.2.

BusinessNZ chief executive Phil O’Reilly said that the May result reinforced views that the level of carnage seen in the services sector abroad hasn’t been as bad in New Zealand.

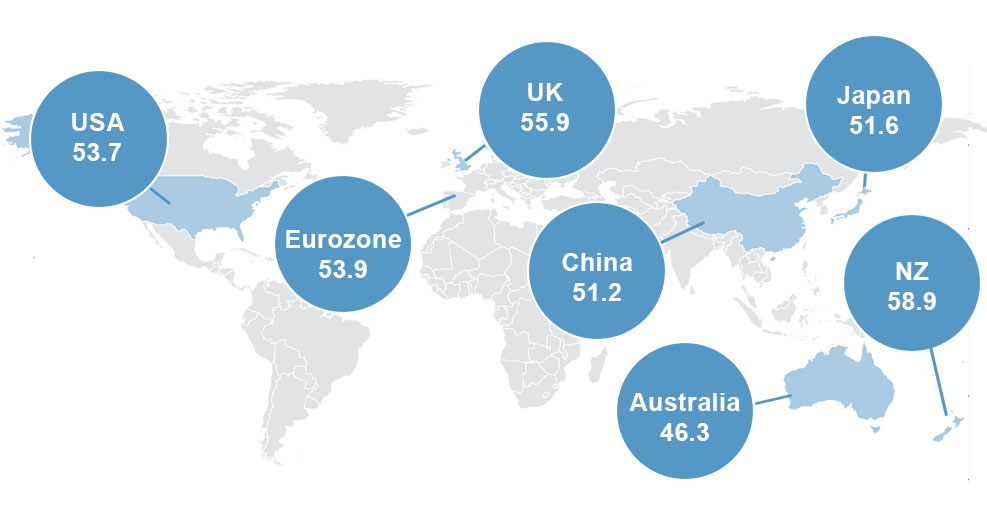
“14 months of consecutive declines is certainly nothing to write home about, especially when compared with results for the first year the survey was running. However, we haven’t experienced a sub-40 result for overall activity, while other countries such as Australia and until recently the broader Eurozone region have seen activity drop to that level. Encouragingly, new orders/business has, for the best part, shown continued resilience in the face of some tough times, but will really need to start showing expansion to help boost activity for the second half of 2009.”

BNZ Capital Senior Economist Craig Ebert says it’s a blessing New Zealand is not involved in the car manufacturing industry, unlike countries like the USA and Japan which are suffering the most. “However, there’s no denying that the recent slump in domestic car sales has hit our economy hard, by way of lessening throughput for the wholesale distribution sector.

“Despite this, there are reasons to believe the worst may soon be behind us. Perhaps the clearest indicator being the extent to which car expenditure has corrected to date – especially on a per capita basis.”

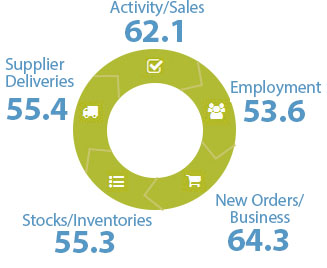
All diffusion indices that make up the PSI exhibited contraction during May, but most showed improvement from April. Activity/sales (43.9) recovered somewhat from a significant drop in April, while employment (46.3) recorded its highest value since December 2008. New orders/business (49.7) came close to a level of no change for May, while stocks/inventories (44.7) increased 2.1 points from the April. Lastly, deliveries (44.7) remained relatively unchanged from the previous month. In comparison with May 2007 and 2008, all sub-indices were lower.

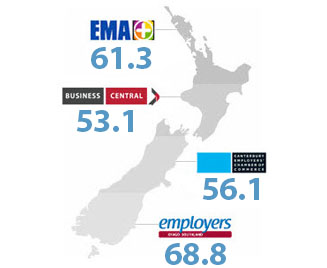
Activity was again negative in all four main regions for May, however half showed a pick-up from April. The Northern region (47.4) recorded its highest value since October 2008, while the Central region (47.2) continued to slip further. The Canterbury/Westland region (43.7) recorded its second lowest ever result (although up from April), while the Otago/Southland region (37.0) dipped under the 40-mark for the first time since October 2008.

Click here to view the May PSI & PCI
Click here to view the PSI time series data
Click here to view the PCI time series data

For media comment: Craig Ebert 04 474 6799

BNZ - BusinessNZ PSI

Time Series Data

View seasonally adjusted and unadjusted time series data for the BNZ - BusinessNZ PSI

Services Landscape

Sponsor Statement

BNZ is delighted to be associated with the Performance of Services Index (PSI) and BusinessNZ.

This association brings together the significant experience of leading business advocacy body BusinessNZ, and business finance specialist BNZ.

We look forward to continuing our association with BusinessNZ and associated regional organisations, and to playing our part in the ongoing development of the New Zealand service sector.

PSI Time Series Table

The results are seasonally adjusted.

BNZ – BusinessNZ PSI Time Series

January 1966 – January 1970

International Results

J.P. Morgan Global Manufacturing PSITM

About the PSI

The BNZ – BusinessNZ Performance of Services Index is a monthly survey of the service sector providing an early indicator of activity levels.

A PSI reading above 50 points indicates service activity is expanding; below 50 indicates it is contracting.

The main PSI and sub-index results are seasonally adjusted.

Technical Contact

Stephen Summers
Economist, BusinessNZ

[email protected]

PSI Releases

Treading water

New Zealand’s services sector continued to display contraction for a sixth consecutive month, according to the BNZ – BusinessNZ Performance of Services Index (PSI). The PSI for July was 48.9 (A PSI reading above 50.0 indicates that the service sector is generally...

Ongoing contraction

New Zealand’s services sector displayed contraction for a fifth consecutive month, according to the BNZ – BusinessNZ Performance of Services Index (PSI). The PSI for June was 47.3 (A PSI reading above 50.0 indicates that the service sector is generally expanding;...

Service with a slump

New Zealand’s services sector continued to show further decline in activity during May, according to the BNZ – BusinessNZ Performance of Services Index (PSI). The PSI for May was 44.0 (A PSI reading above 50.0 indicates that the service sector is generally expanding;...

Declining fortunes

New Zealand’s services sector showed further decline in activity during April, according to the BNZ – BusinessNZ Performance of Services Index (PSI). The PSI for April was 48.5 (A PSI reading above 50.0 indicates that the service sector is generally expanding; below...

Continued softness

New Zealand’s services sector continued to show slight contraction during March, according to the BNZ – BusinessNZ Performance of Services Index (PSI). The PSI for March was 49.1 (A PSI reading above 50.0 indicates that the service sector is generally expanding; below...

BNZ – BusinessNZ
Performance of
Composite Index

PCI Time Series Table

The results are seasonally adjusted.

BNZ – BusinessNZ PCI Time Series

January 1966 – January 1970

About the PCI

The BNZ – BusinessNZ Performance of Composite Index (PCI) takes into account results from both the Performance of Manufacturing Index (PMI) and the Performance of Services Index (PSI). Combined results are shown in two ways:

GDP-Weighted Index:
Apportions the weight of the manufacturing and services index within the economy to produce an overall result.

Free-Weighted Index:
Combines data from both indexes to produce an overall result.

Both time series for the PCI are then seasonally adjusted.

BNZ - BusinessNZ PCI

Time Series Data

View seasonally adjusted and unadjusted time series data for the BNZ - BusinessNZ PCI

Our Contributors

The BNZ – BusinessNZ PSI contains data obtained through BusinessNZ’s regional organisations