BNZ – BusinessNZ
Performance of
Services Index

Service sector activity falls sharply – PSI

14 Jul, 2008

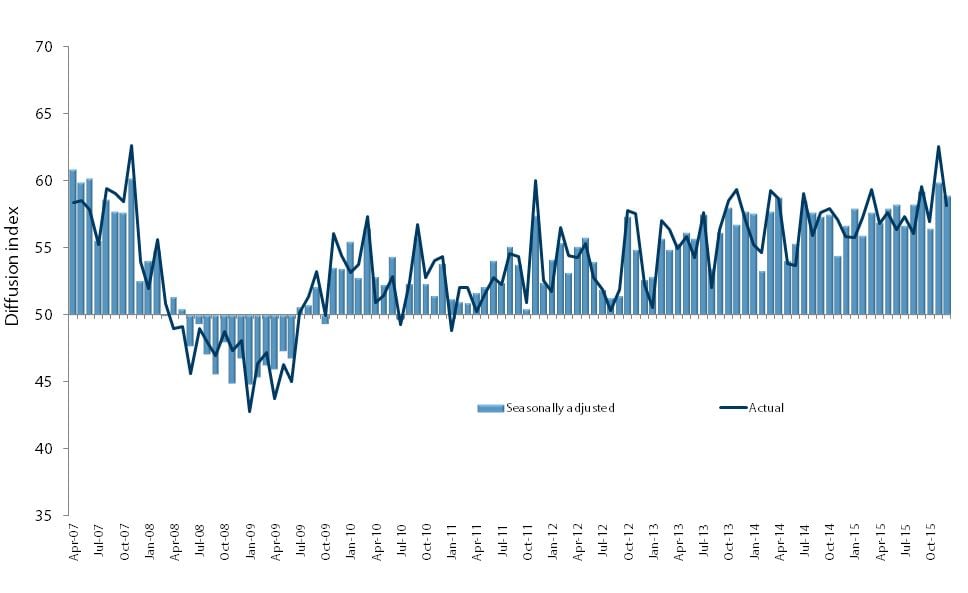
Activity in the service sector has reached its lowest level since the BNZ – BusinessNZ Performance of Services Index (PSI) began.

The PSI for June stood at 45.6, down 3.5 points from May, and 12.2 points down from the same time last year. A PSI reading above 50.0 indicates the service sector is generally expanding; below 50.0 that it is declining. The average PSI value since the survey began 16 months ago is 55.0.

BusinessNZ chief executive Phil O’Reilly said the June result was consistent with other sectors of the economy, also taking a hit from the general downturn in the economy.

The significant drop in overall activity in June follows three months of stagnant growth in the sector. Comments from respondents show operating costs continue to rise, while a drop in customers and ongoing/new contracts has also been felt throughout the sector. Although there may be seasonal factors at work, respondents have also noted that overall activity was still down on the same time last year.

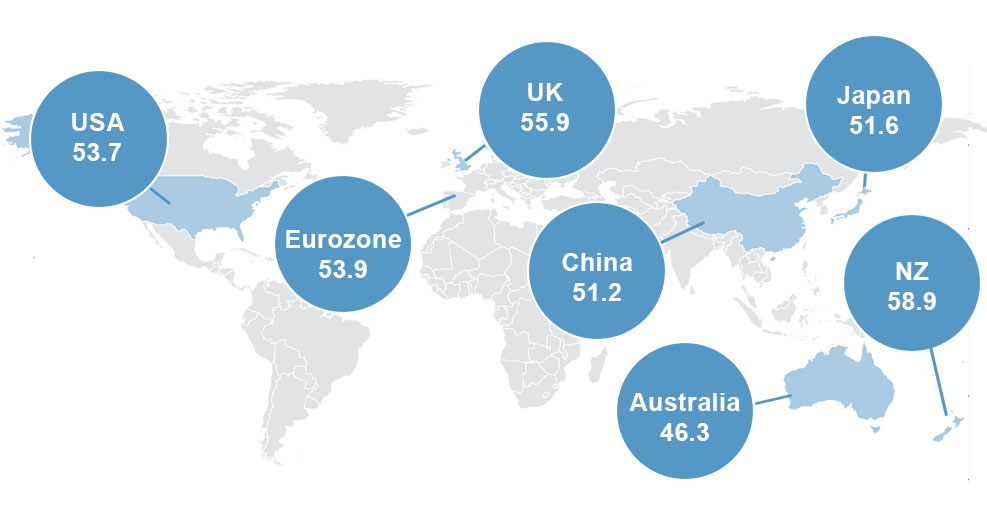
“Looking offshore, the PSI survey in Australia has seen similar results, with overall activity dropping off sharply in June to a level equivalent with New Zealand’s. The latest JPMorgan Global PSI for June (49.3) also contracted for the first time in five months, so there looks to be little respite for those businesses who are more heavily engaged in the global market.

The Bank of New Zealand’s senior markets economist, Craig Ebert, said the obvious slump in the employment sub-index warned of tougher times ahead in the job market and fading job security.

“This fits with a number of other measures that warn us the jobs market is about to come off the boil much more obviously than has been the case in the official records to date.”

Mr Ebert said this would take the steam out of wage inflation. “Gone will be the days where employees had many alternative jobs they could jump to, which would guarantee a big pay rise jump.”

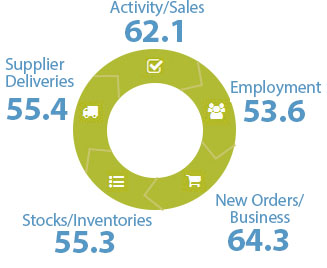
Four of the five diffusion indices that make up the PSI continued to exhibit decline, while all exhibited their lowest ever values. Activity/sales (44.9) displayed its third consecutive level of contraction, while employment (41.8) dropped significantly from May. Supplier deliveries (42.7) was also in strong decline, however new orders/business (51.4) remained in positive territory.

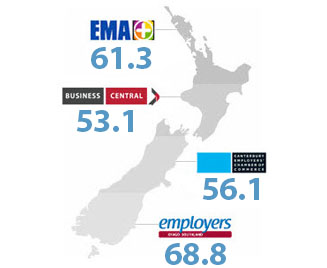
Regional breakdowns showed almost all areas in contraction mode. The Otago/Southland region (36.1) continued to be the worst hit, following two months of falls in activity. Both the Northern (43.9) and Central (47.9) regions experienced a decrease after the May result of largely no change, while the Canterbury/Westland region (51.1) remained the only area where results over recent months have steadily improved.

Click here to view the June PSI & PCI
Click here to view the PSI time series data
Click here to view the PCI time series data

For media comment: Georgina Bond, 021 959 831

BNZ - BusinessNZ PSI

Time Series Data

View seasonally adjusted and unadjusted time series data for the BNZ - BusinessNZ PSI

Services Landscape

Sponsor Statement

BNZ is delighted to be associated with the Performance of Services Index (PSI) and BusinessNZ.

This association brings together the significant experience of leading business advocacy body BusinessNZ, and business finance specialist BNZ.

We look forward to continuing our association with BusinessNZ and associated regional organisations, and to playing our part in the ongoing development of the New Zealand service sector.

PSI Time Series Table

The results are seasonally adjusted.

BNZ – BusinessNZ PSI Time Series

January 1966 – January 1970

International Results

J.P. Morgan Global Manufacturing PSITM

About the PSI

The BNZ – BusinessNZ Performance of Services Index is a monthly survey of the service sector providing an early indicator of activity levels.

A PSI reading above 50 points indicates service activity is expanding; below 50 indicates it is contracting.

The main PSI and sub-index results are seasonally adjusted.

Technical Contact

Stephen Summers
Economist, BusinessNZ

[email protected]

PSI Releases

Treading water

New Zealand’s services sector continued to display contraction for a sixth consecutive month, according to the BNZ – BusinessNZ Performance of Services Index (PSI). The PSI for July was 48.9 (A PSI reading above 50.0 indicates that the service sector is generally...

Ongoing contraction

New Zealand’s services sector displayed contraction for a fifth consecutive month, according to the BNZ – BusinessNZ Performance of Services Index (PSI). The PSI for June was 47.3 (A PSI reading above 50.0 indicates that the service sector is generally expanding;...

Service with a slump

New Zealand’s services sector continued to show further decline in activity during May, according to the BNZ – BusinessNZ Performance of Services Index (PSI). The PSI for May was 44.0 (A PSI reading above 50.0 indicates that the service sector is generally expanding;...

Declining fortunes

New Zealand’s services sector showed further decline in activity during April, according to the BNZ – BusinessNZ Performance of Services Index (PSI). The PSI for April was 48.5 (A PSI reading above 50.0 indicates that the service sector is generally expanding; below...

Continued softness

New Zealand’s services sector continued to show slight contraction during March, according to the BNZ – BusinessNZ Performance of Services Index (PSI). The PSI for March was 49.1 (A PSI reading above 50.0 indicates that the service sector is generally expanding; below...

BNZ – BusinessNZ
Performance of
Composite Index

PCI Time Series Table

The results are seasonally adjusted.

BNZ – BusinessNZ PCI Time Series

January 1966 – January 1970

About the PCI

The BNZ – BusinessNZ Performance of Composite Index (PCI) takes into account results from both the Performance of Manufacturing Index (PMI) and the Performance of Services Index (PSI). Combined results are shown in two ways:

GDP-Weighted Index:
Apportions the weight of the manufacturing and services index within the economy to produce an overall result.

Free-Weighted Index:
Combines data from both indexes to produce an overall result.

Both time series for the PCI are then seasonally adjusted.

BNZ - BusinessNZ PCI

Time Series Data

View seasonally adjusted and unadjusted time series data for the BNZ - BusinessNZ PCI

Our Contributors

The BNZ – BusinessNZ PSI contains data obtained through BusinessNZ’s regional organisations