Overall activity in the service sector for the first month of 2011 displayed a fairly lacklustre beginning, while the newly established Combined Index shows a similar pattern to the end of 2010, according to the BNZ- BusinessNZ Performance of Services Index (PSI).
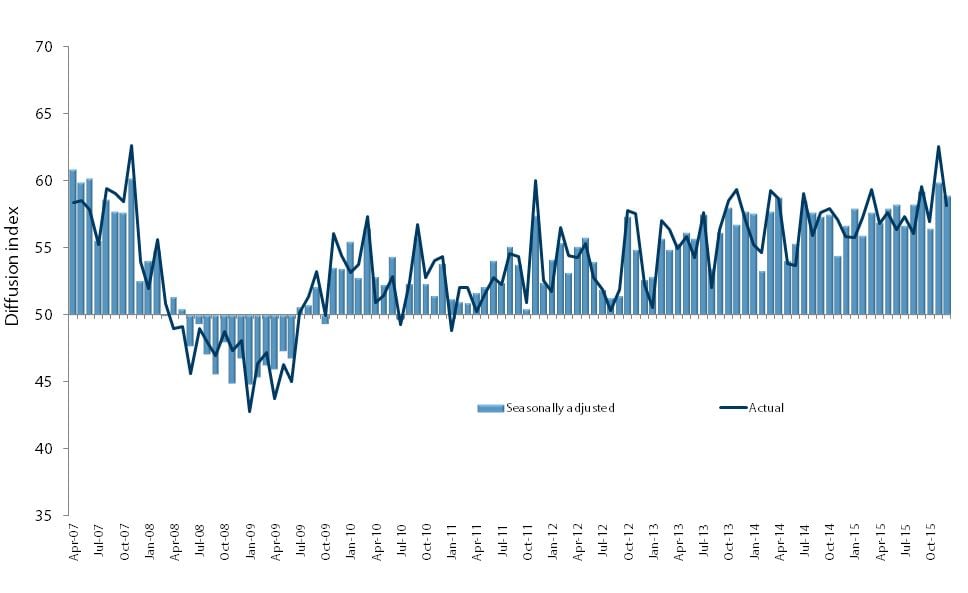
The PSI for January was 50.8. This was down 1.3 points from December, and down from 55.2 for the 2010 January month. A PSI reading above 50.0 indicates that the service sector is generally expanding; below 50.0 that it is declining. The average PSI value for 2009 was 48.8, while for 2010 it was 53.2.
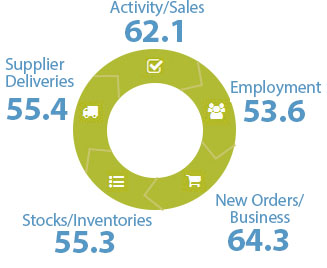
BusinessNZ chief executive Phil O’Reilly said that the uninspiring result for the January PSI would have been worse had it not been for continued strength in new orders/business.
“While new orders/business fell from December, it remained high enough to ensure there was a degree of expansion in January. Looking at the other end of the spectrum, the drop in employment to its lowest level since August 2009 was an unwelcome result, and represents four consecutive months in decline.
“In terms of providing further economic information on the current state of the economy, both BNZ and BusinessNZ are pleased to announce a new regular contribution to the monthly PMI and PSI releases that have been running for a number of years.
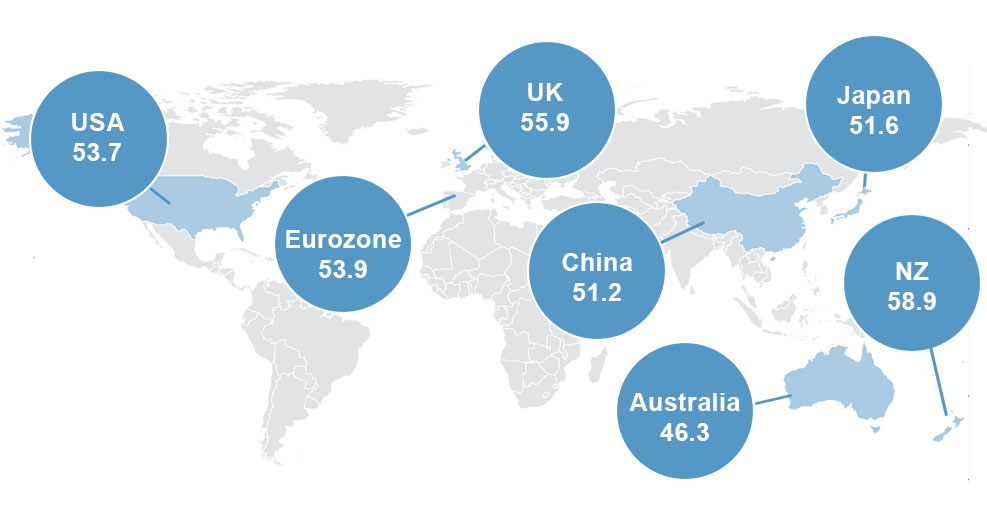
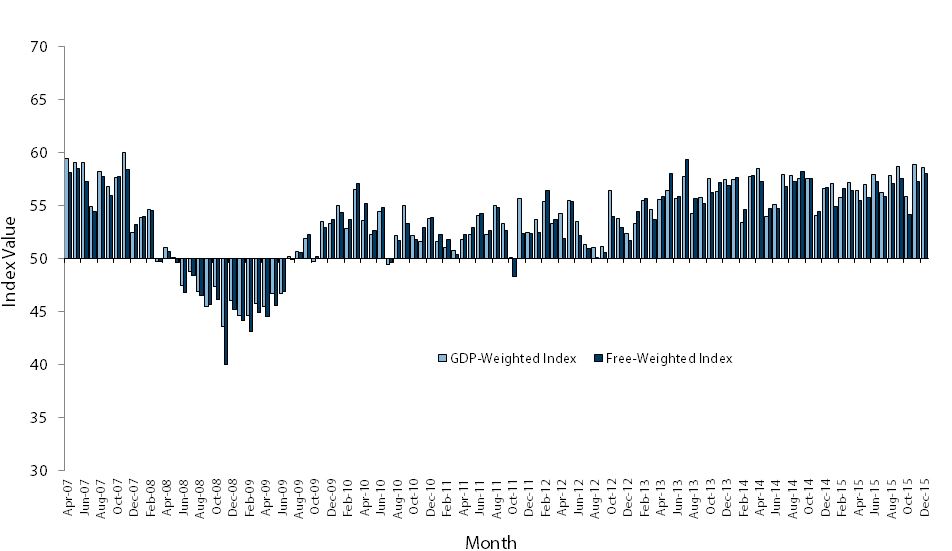
“The January 2011 release represents the first time BNZ and BusinessNZ have introduced the BNZ – BusinessNZ Performance of Composite Index (PCI)*, which combines the results of both the PSI and PMI to illustrate how around 80% of New Zealand’s GDP is performing on a monthly basis, as well as further aligning New Zealand’s performance indexes with the rest of the world.
“The two methods employed to measure the PCI for January show a very similar pattern to the last three months of 2010, with activity expansionary but struggling to kick clear of the no-change mark of 50.
“The time series of results going back to early 2007 show that while the combined results have enjoyed 15 consecutive months of expansion, the level of expansion is still nowhere near a period of stronger recovery between late 2009 and mid 2010.
BNZ senior economist Craig Ebert said the newly created PCI offers a bigger picture take on the economy’s pulse.
“Whether weighted by GDP or free weighted, the PCI has remained in expansion mode for several months now. While the figures don’t inspire confidence of a strong pick-up being underway, they do negate suggestions that the NZ economy is re-entering recession.
“While some people’s former optimism has now been replaced with frustration, the PCI shows things do look quite different to how they did a couple of years ago.
“We look forward to monitoring the new PCI during what still looks like being a fairly turbulent year, as it offers as timely a pulse as is publicly available on the bigger picture of our economic performance.”
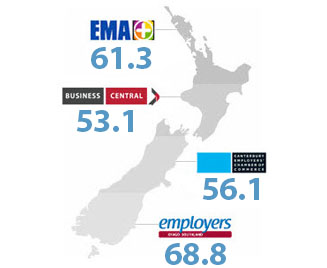
Unadjusted activity by region for the PSI exhibited more of a similar level of activity throughout the country compared with recent months. The Northern region (50.0) fell to its lowest level since October 2009, while the Central region (49.3) dipped below the 50.0 point mark for the first time since August 2010. The South Island also experienced a fall in activity, with the Canterbury/Westland region (44.7) returning to activity levels experienced in November 2010, and the Otago/Southland region(46.3) returning to declines.
* For more information on the newly established BNZ – BusinessNZ PCI (including time series tables/graphs, as well as methodology), please see page 3 of the main PSI release.
Click here to view the January PSI & PCI
Click here to view the PSI time series data
Click here to view the PCI time series data
For media comment: Phil O’Reilly 04 4966552 or Craig Ebert 04 474 6799