BNZ – BusinessNZ
Performance of
Services Index

In the black – PSI

19 Apr, 2022
51.6
March
+2.7

Monthly Change

expanding
previously contracting

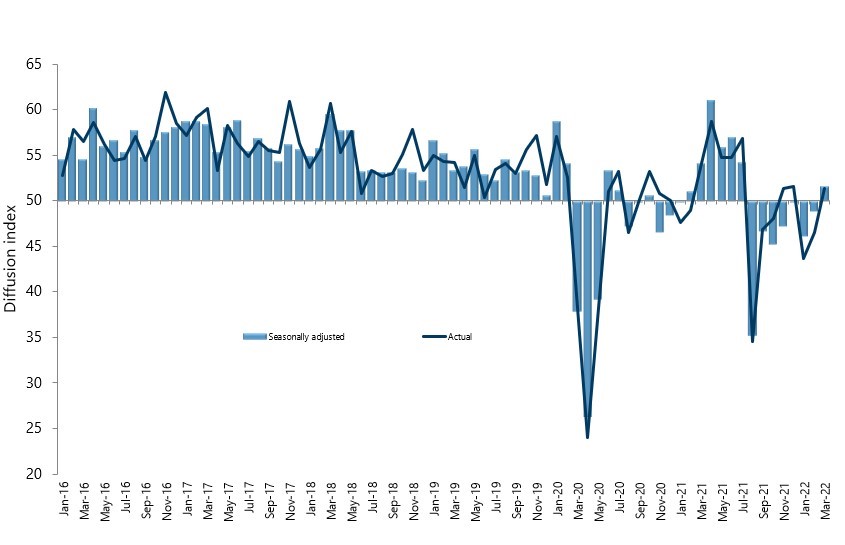
After seven months in contraction, activity levels in New Zealand’s services sector saw expansion in March, according to the BNZ – BusinessNZ Performance of Services Index (PSI).

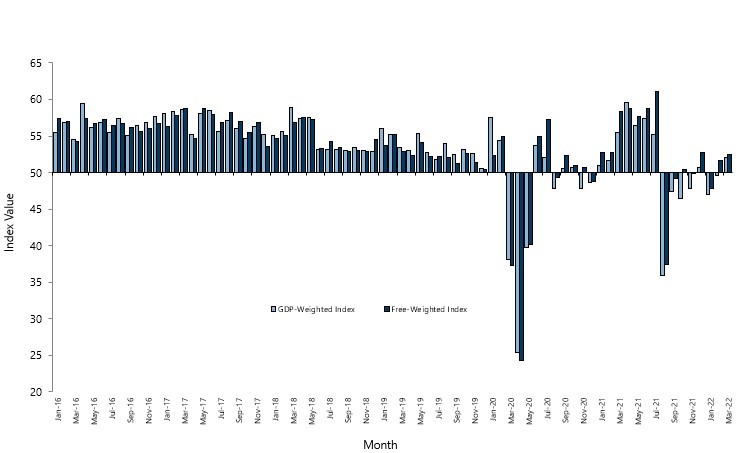
The PSI for March was 51.6 (A PSI reading above 50.0 indicates that the service sector is generally expanding; below 50.0 that it is declining).  This was up 2.7 points from February, but still below the long-term average of 53.6 for the survey.

BusinessNZ chief executive Kirk Hope said that after a difficult period for many businesses in the services sector, a return to overall expansion was welcomed.  However,  the underlying results show there is still some way to go to return to what many would consider business as usual. 

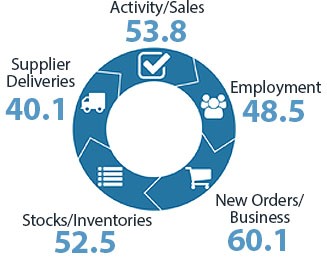
“The two key sub-indexes of New Orders/Business (60.1) and Activity/Sales (53.8) both continued their upwards momentum.  However, Employment (48.5) and Supplier Deliveries (40.1) remain in contraction.  In addition, the proportion of negative comments stands at 57.5%, although this is down from 61.5% in February.”

BNZ Senior Economist Craig Ebert said that “despite some horribly weak components, the PSI supported the idea that GDP is on track to recover in Q2, after a flat-to-negative performance in Q1.”

Activity/Sales
53.8
Employment
48.5
New Orders/
Business
60.1
Stocks/Inventories
52.5
Supplier
Deliveries
40.1
54.3
47.8
58.6
30.6
Kirk Hope

Kirk Hope

CEO, BusinessNZ

BNZ - BusinessNZ PSI

Time Series Data

View seasonally adjusted and unadjusted time series data for the BNZ - BusinessNZ PSI

Services Landscape

Positivity

March’s Performance of Services Index (PSI) held out hope of better times, in many ways. Overall, it was good to see the first expansion in 8 months, with a seasonally adjusted index reading of 51.6.
Read more

Supply Constraints

Complaints about supply-side factors certainly remained to the fore in feedback to March’s PSI, with references to “Covid/Omicron”, “Red”, “staffing” and “(international) supply chains”.
Read more

Back from the Abyss?

So, when we look at Cultural, Recreation & Personal, still way down in the dumps in March at 15.6, it’s not hard to imagine upside for this events-driven category in the coming months.
Read more

Growth implications

Even as it was in March, and despite some horribly weak components, the PSI supported the idea that GDP is on track to recover in Q2, after a flat-to-negative performance in Q1.
Read more

Craig Ebert

Craig Ebert

Senior Economist, BNZ

Sponsor Statement

BNZ is delighted to be associated with the Performance of Services Index (PSI) and BusinessNZ.

This association brings together the significant experience of leading business advocacy body BusinessNZ, and business finance specialist BNZ.

We look forward to continuing our association with BusinessNZ and associated regional organisations, and to playing our part in the ongoing development of the New Zealand service sector.

PSI Time Series Table

The results are seasonally adjusted.

National Indicies Mar
2021
Nov
2021
Dec
2021
Jan
2022
Feb
2022
Mar
2022
BNZ – BusinessNZ PSI 54.1 47.3 49.9 46.2 48.9 51.6
Activity/Sales 57.1 46.6 50.9 44.6 50.9 53.8
Employment 52.2 50.4 49.1 47.4 45.0 48.5
New Orders/Business 61.1 53.3 52.2 40.9 55.3 60.1
Stocks/Inventories 50.1 47.2 51.2 48.3 50.3 52.5
Supplier Deliveries 44.9 37.9 49.6 43.6 34.4 40.1

BNZ – BusinessNZ PSI Time Series

March 2018 – March 2022

International Results

J.P. Morgan Global Manufacturing PSITM

06 Apr 2022
53.4
USA
58.0
UK
62.6
Eurozone
55.6
China
42.0
Japan
49.4
Australia
56.2
NZ
51.6

About the PSI

The BNZ – BusinessNZ Performance of Services Index is a monthly survey of the service sector providing an early indicator of activity levels.

A PSI reading above 50 points indicates service activity is expanding; below 50 indicates it is contracting.

The main PSI and sub-index results are seasonally adjusted.

Technical Contact

Stephen Summers
Economist, BusinessNZ

[email protected]

PSI Releases

Treading water

New Zealand’s services sector continued to display contraction for a sixth consecutive month, according to the BNZ – BusinessNZ Performance of Services Index (PSI). The PSI for July was 48.9 (A PSI reading above 50.0 indicates that the service sector is generally...

Ongoing contraction

New Zealand’s services sector displayed contraction for a fifth consecutive month, according to the BNZ – BusinessNZ Performance of Services Index (PSI). The PSI for June was 47.3 (A PSI reading above 50.0 indicates that the service sector is generally expanding;...

Service with a slump

New Zealand’s services sector continued to show further decline in activity during May, according to the BNZ – BusinessNZ Performance of Services Index (PSI). The PSI for May was 44.0 (A PSI reading above 50.0 indicates that the service sector is generally expanding;...

Declining fortunes

New Zealand’s services sector showed further decline in activity during April, according to the BNZ – BusinessNZ Performance of Services Index (PSI). The PSI for April was 48.5 (A PSI reading above 50.0 indicates that the service sector is generally expanding; below...

Continued softness

New Zealand’s services sector continued to show slight contraction during March, according to the BNZ – BusinessNZ Performance of Services Index (PSI). The PSI for March was 49.1 (A PSI reading above 50.0 indicates that the service sector is generally expanding; below...

BNZ – BusinessNZ
Performance of
Composite Index

52.0

GDP-Weighted Index

52.5

Free-Weighted Index

The seasonally adjusted BNZ – BusinessNZ Performance of Composite Index or PCI (which combines the PMI and PSI) saw both options for measuring the March PCI in expansion, which isthe first time this has occurred since December 2021.

The March GDP-Weighted Index (52.0) increased 2.4 points from February, while the Free-Weighted Index (52.5) rose 0.9 points.

PCI Time Series Table

The results are seasonally adjusted.

National Indices Mar
2021
Nov
2021
Dec
2021
Jan
2022
Feb
2022
Mar
2022
GDP-Weighted Index 55.5 47.8 50.7 47.0 49.6 52.0
Free-Weighted Index 58.4 49.8 52.8 47.8 51.6 52.5

BNZ – BusinessNZ PCI Time Series

March 2018 – March 2022

About the PCI

The BNZ – BusinessNZ Performance of Composite Index (PCI) takes into account results from both the Performance of Manufacturing Index (PMI) and the Performance of Services Index (PSI). Combined results are shown in two ways:

GDP-Weighted Index:
Apportions the weight of the manufacturing and services index within the economy to produce an overall result.

Free-Weighted Index:
Combines data from both indexes to produce an overall result.

Both time series for the PCI are then seasonally adjusted.

BNZ - BusinessNZ PCI

Time Series Data

View seasonally adjusted and unadjusted time series data for the BNZ - BusinessNZ PCI

Our Contributors

The BNZ – BusinessNZ PSI contains data obtained through BusinessNZ’s regional organisations