BNZ – BusinessNZ
Performance of
Services Index

Difficult times – PSI

15 Mar, 2022
48.6
February
+2.6

Monthly Change

contracting
slower rate

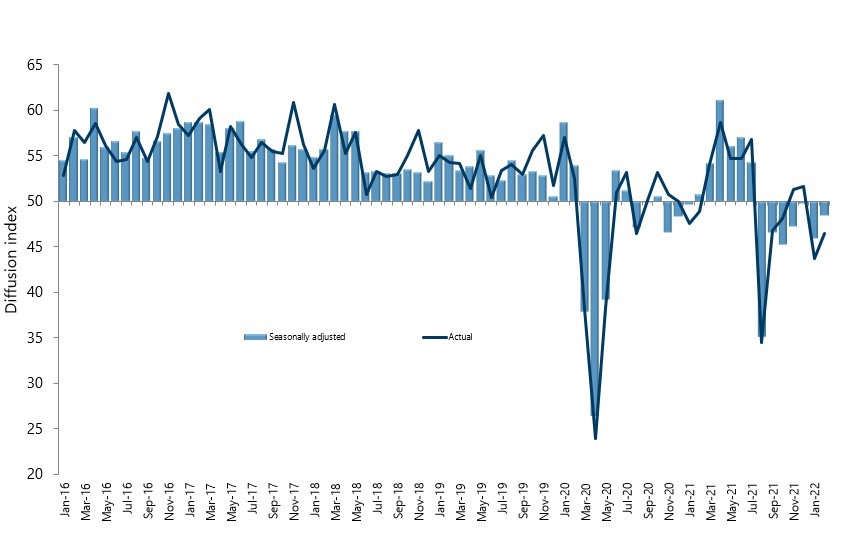
Activity levels in New Zealand’s services sector saw a continuation of contraction for the second month of 2022, according to the BNZ – BusinessNZ Performance of Services Index (PSI).

The PSI for February was 48.6 (A PSI reading above 50.0 indicates that the service sector is generally expanding; below 50.0 that it is declining).  While this was up 2.6 points from January, it was still well down on the long-term average of 53.6 for the survey.

BusinessNZ chief executive Kirk Hope said that the ongoing trend of contraction was expected given the current restrictions and interference many businesses in the services sector are experiencing at present.

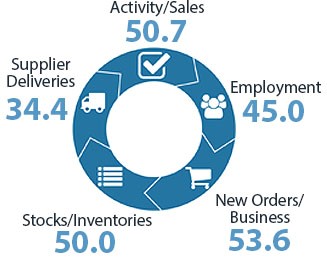
“It was encouraging to see the key sub-indexes of New Orders/Business (53.6) and Activity/Sales (50.7) both return to positive territory.  However, Employment (45.0) dropped to its lowest result since May 2020, while Supplier Deliveries (34.4) was at its lowest point since August 2021.”

BNZ Senior Economist Doug Steel said that “February marks the PSI’s seventh consecutive month below the breakeven 50 mark. Pain is accumulating. While there were some overs and unders in the components, all remain below their respective long-term averages.”

Kirk Hope

Kirk Hope

CEO, BusinessNZ

BNZ - BusinessNZ PSI

Time Series Data

View seasonally adjusted and unadjusted time series data for the BNZ - BusinessNZ PSI

Services Landscape

Could have been worse?

February’s Performance of Services Index (PSI) was conceivably better than some might have thought, given Omicron’s escalating spread through the country during the month. But, at 48.6, which was a touch higher than January’s 46.0, the PSI remains weak.
Read more

Ups and downs

New orders and activity/sales did bounce back a bit above 50, but only from very weak January readings. Deliveries took another lurch lower, indicating supply side bottlenecks got worse during February.
Read more

Massive variation

Variation across industries was extreme in February. Omicron’s impact is there for all to see in the likes of accommodation, cafes, and restaurants with its lowest ever PSI recording of 11.2. Just dreadful.
Read more

Growth implications

GDP in the services sector, as a whole, might well have posted a decent bounce in Q4 if recently released Stats NZ indicators are any guide. The official GDP data are out on Thursday..
Read more

Doug Steel

Doug Steel

Senior Economist, BNZ

Sponsor Statement

BNZ is delighted to be associated with the Performance of Services Index (PSI) and BusinessNZ.

This association brings together the significant experience of leading business advocacy body BusinessNZ, and business finance specialist BNZ.

We look forward to continuing our association with BusinessNZ and associated regional organisations, and to playing our part in the ongoing development of the New Zealand service sector.

PSI Time Series Table

The results are seasonally adjusted.

National Indicies Feb
2021
Oct
2021
Nov
2021
Dec
2021
Jan
2022
Feb
2022
BNZ – BusinessNZ PSI 50.8 45.3 47.3 49.9 46.0 48.6
Activity/Sales 52.3 44.8 46.5 50.9 44.6 50.7
Employment 52.1 50.2 50.4 49.1 47.2 45.0
New Orders/Business 50.6 47.5 53.4 52.2 41.2 53.6
Stocks/Inventories 45.9 46.2 47.2 51.1 48.0 50.0
Supplier Deliveries 42.3 36.9 37.9 49.6 43.4 34.4

BNZ – BusinessNZ PSI Time Series

February 2018 – February 2022

International Results

J.P. Morgan Global Manufacturing PSITM

04 Mar 2022
53.9

About the PSI

The BNZ – BusinessNZ Performance of Services Index is a monthly survey of the service sector providing an early indicator of activity levels.

A PSI reading above 50 points indicates service activity is expanding; below 50 indicates it is contracting.

The main PSI and sub-index results are seasonally adjusted.

Technical Contact

Stephen Summers
Economist, BusinessNZ

[email protected]

PSI Releases

Treading water

New Zealand’s services sector continued to display contraction for a sixth consecutive month, according to the BNZ – BusinessNZ Performance of Services Index (PSI). The PSI for July was 48.9 (A PSI reading above 50.0 indicates that the service sector is generally...

Ongoing contraction

New Zealand’s services sector displayed contraction for a fifth consecutive month, according to the BNZ – BusinessNZ Performance of Services Index (PSI). The PSI for June was 47.3 (A PSI reading above 50.0 indicates that the service sector is generally expanding;...

Service with a slump

New Zealand’s services sector continued to show further decline in activity during May, according to the BNZ – BusinessNZ Performance of Services Index (PSI). The PSI for May was 44.0 (A PSI reading above 50.0 indicates that the service sector is generally expanding;...

Declining fortunes

New Zealand’s services sector showed further decline in activity during April, according to the BNZ – BusinessNZ Performance of Services Index (PSI). The PSI for April was 48.5 (A PSI reading above 50.0 indicates that the service sector is generally expanding; below...

Continued softness

New Zealand’s services sector continued to show slight contraction during March, according to the BNZ – BusinessNZ Performance of Services Index (PSI). The PSI for March was 49.1 (A PSI reading above 50.0 indicates that the service sector is generally expanding; below...

BNZ – BusinessNZ
Performance of
Composite Index

49.4

GDP-Weighted Index

51.5

Free-Weighted Index

The seasonally adjusted BNZ – BusinessNZ Performance of Composite Index or PCI (which combines the PMI and PSI) saw the two options for measuring the February PCI both improve from the previous month. 

The February GDP-Weighted Index (49.4) increased 2.5 points from January, while the Free-Weighted Index (51.5) rose 3.9 points.

PCI Time Series Table

The results are seasonally adjusted.

National Indices Feb
2021
Oct
2021
Nov
2021
Dec
2021
Jan
2022
Feb
2022
GDP-Weighted Index 51.5 46.4 47.8 50.6 46.9 49.4
Free-Weighted Index 52.6 50.3 49.8 52.8 47.6 51.5

BNZ – BusinessNZ PCI Time Series

February 2018 – February 2022

About the PCI

The BNZ – BusinessNZ Performance of Composite Index (PCI) takes into account results from both the Performance of Manufacturing Index (PMI) and the Performance of Services Index (PSI). Combined results are shown in two ways:

GDP-Weighted Index:
Apportions the weight of the manufacturing and services index within the economy to produce an overall result.

Free-Weighted Index:
Combines data from both indexes to produce an overall result.

Both time series for the PCI are then seasonally adjusted.

BNZ - BusinessNZ PCI

Time Series Data

View seasonally adjusted and unadjusted time series data for the BNZ - BusinessNZ PCI

Our Contributors

The BNZ – BusinessNZ PSI contains data obtained through BusinessNZ’s regional organisations