BNZ – BusinessNZ
Performance of
Services Index

Solid but not spectacular – PSI

17 Dec, 2012

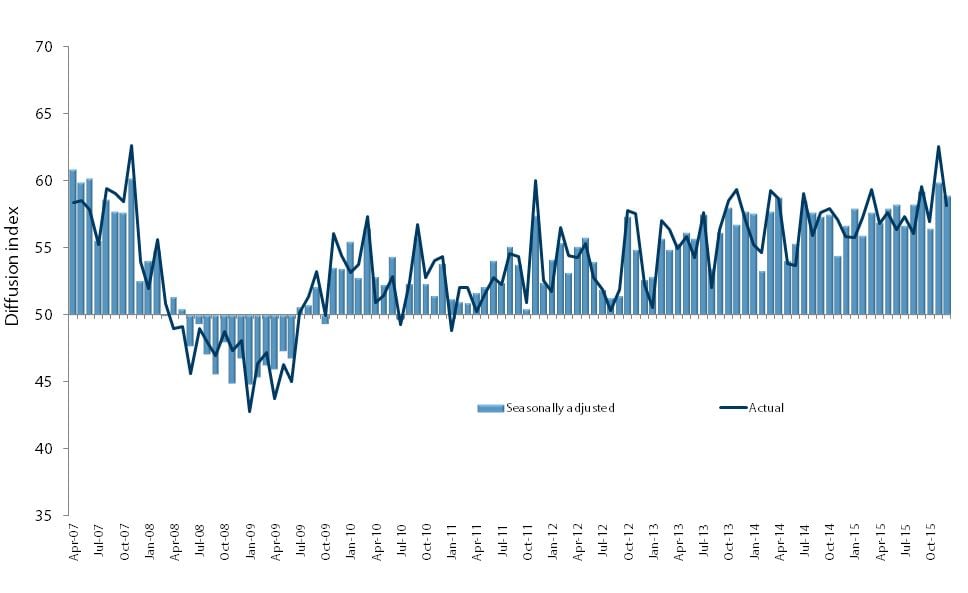
The service sector remains in expansion mode, but not at the level as last month, according to the BNZ – BusinessNZ Performance of Services Index (PSI).

The PSI for November was 54.1. This was down 4.0 points from October, although still higher than results from June to September (A PSI reading above 50.0 indicates that the service sector is generally expanding; below 50.0 that it is declining). Compared to previous November results, the 2012 value was the third highest recorded since 2007.

BusinessNZ chief executive Phil O’Reilly said that the comments from respondents outline a distinct difference when examining those who have seen activity expand, compared with those that have not.

“In November, 65% of comments were positive, compared with 62% in October and 47% in September. The increase is obviously good news, but the types of comments received are more specific to a particular reason such as better weather conditions, detailed Xmas prospects or certain tourist opportunities on the scene. In contrast, those still struggling are often more general in their comments, with a lack of customers/orders being the primary concern.

BNZ Head of Research Stephen Toplis expects 2012’s theme of slow progress, despite continuing struggle, to continue into 2013.

“New Zealand’s economic outlook for calendar 2013 is unspectacular, but against a global backdrop of significant distress, this is not a bad place to be.

“We are forecasting GDP to expand an annual average of 2.3%, mainly due to significant forecasted increase in construction activity. This will be accompanied by heightened consumption in durable goods.”

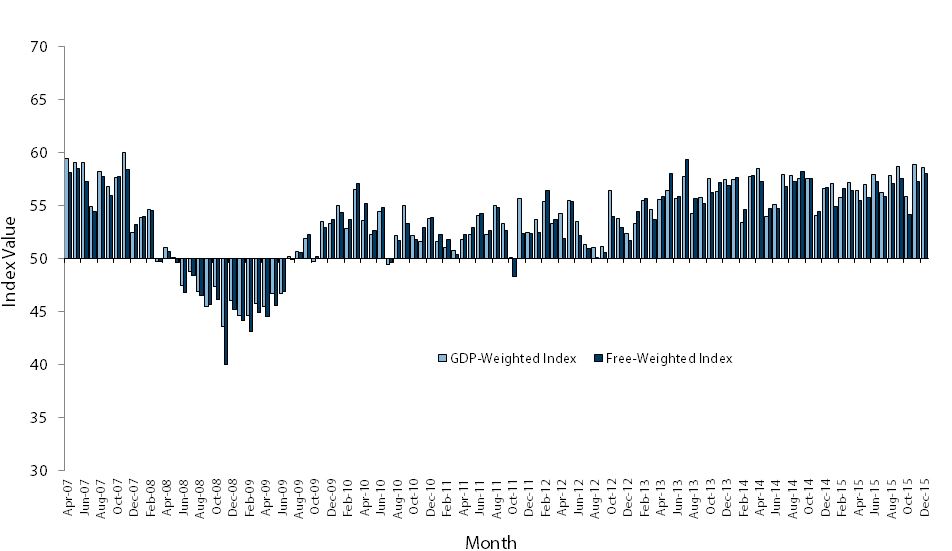
The seasonally adjusted BNZ – BusinessNZ Performance of Composite Index or PCI (which combines the PMI and PSI) for November continued to show the two options for measuring the PCI in expansion, although down from October. The GDP-Weighted Index (52.2) decreased 5.1 points from October, while the Free-Weighted Index (51.2) fell 3.9 points over the same period. While the pick-up in the unadjusted manufacturing sector assisted in boosting both PCI indices, the results were not strong enough to see uplift once seasonal factors were taken into account.

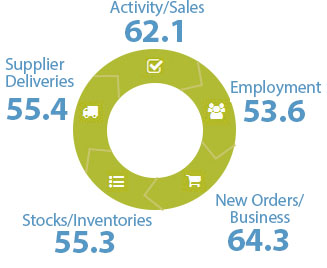
Four of the five main sub-indices were in expansion during November. New orders/business (58.1) led the way, but was down 4.8 points from the previous month. Likewise, new activity/sales (55.4) fell back 9.0 points, although remained in healthy expansion. In contrast, employment (49.9) dropped 2.1 points to stand at all but no change for November, while supplier deliveries (52.2) kept its head above the no change mark. Finished stocks (51.7) remained very consistent with previous recent results, with a range of only 1.7 points since May.

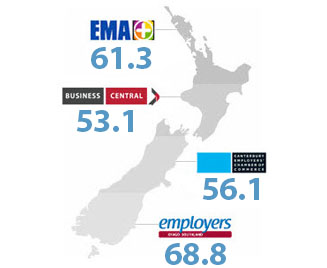
Three of the four regions were again in expansion during November. In the North Island, the Northern region (61.0) continued to build on its previous monthly result with its highest figure since November 2007. The Central region (55.0) bounced back from consecutive monthly declines to indicate expansion at similar levels during the middle of the year. In the South Island, the Canterbury/Westland region (43.3) fell back sharply, while the Otago/Southland region (61.7) showed on-going momentum after a pick-up in October.

Click here to view the November PSI & PCI
Click here to view the PSI time series data
Click here to view the PCI time series data

For media comment: Phil O’Reilly 04 4966552 or Stephen Toplis 04 474 6905

BNZ - BusinessNZ PSI

Time Series Data

View seasonally adjusted and unadjusted time series data for the BNZ - BusinessNZ PSI

Services Landscape

Sponsor Statement

BNZ is delighted to be associated with the Performance of Services Index (PSI) and BusinessNZ.

This association brings together the significant experience of leading business advocacy body BusinessNZ, and business finance specialist BNZ.

We look forward to continuing our association with BusinessNZ and associated regional organisations, and to playing our part in the ongoing development of the New Zealand service sector.

PSI Time Series Table

The results are seasonally adjusted.

BNZ – BusinessNZ PSI Time Series

January 1966 – January 1970

International Results

J.P. Morgan Global Manufacturing PSITM

About the PSI

The BNZ – BusinessNZ Performance of Services Index is a monthly survey of the service sector providing an early indicator of activity levels.

A PSI reading above 50 points indicates service activity is expanding; below 50 indicates it is contracting.

The main PSI and sub-index results are seasonally adjusted.

Technical Contact

Stephen Summers
Economist, BusinessNZ

[email protected]

PSI Releases

Treading water

New Zealand’s services sector continued to display contraction for a sixth consecutive month, according to the BNZ – BusinessNZ Performance of Services Index (PSI). The PSI for July was 48.9 (A PSI reading above 50.0 indicates that the service sector is generally...

Ongoing contraction

New Zealand’s services sector displayed contraction for a fifth consecutive month, according to the BNZ – BusinessNZ Performance of Services Index (PSI). The PSI for June was 47.3 (A PSI reading above 50.0 indicates that the service sector is generally expanding;...

Service with a slump

New Zealand’s services sector continued to show further decline in activity during May, according to the BNZ – BusinessNZ Performance of Services Index (PSI). The PSI for May was 44.0 (A PSI reading above 50.0 indicates that the service sector is generally expanding;...

Declining fortunes

New Zealand’s services sector showed further decline in activity during April, according to the BNZ – BusinessNZ Performance of Services Index (PSI). The PSI for April was 48.5 (A PSI reading above 50.0 indicates that the service sector is generally expanding; below...

Continued softness

New Zealand’s services sector continued to show slight contraction during March, according to the BNZ – BusinessNZ Performance of Services Index (PSI). The PSI for March was 49.1 (A PSI reading above 50.0 indicates that the service sector is generally expanding; below...

BNZ – BusinessNZ
Performance of
Composite Index

PCI Time Series Table

The results are seasonally adjusted.

BNZ – BusinessNZ PCI Time Series

January 1966 – January 1970

About the PCI

The BNZ – BusinessNZ Performance of Composite Index (PCI) takes into account results from both the Performance of Manufacturing Index (PMI) and the Performance of Services Index (PSI). Combined results are shown in two ways:

GDP-Weighted Index:
Apportions the weight of the manufacturing and services index within the economy to produce an overall result.

Free-Weighted Index:
Combines data from both indexes to produce an overall result.

Both time series for the PCI are then seasonally adjusted.

BNZ - BusinessNZ PCI

Time Series Data

View seasonally adjusted and unadjusted time series data for the BNZ - BusinessNZ PCI

Our Contributors

The BNZ – BusinessNZ PSI contains data obtained through BusinessNZ’s regional organisations