BNZ – BusinessNZ
Performance of
Services Index

Service sector shows strong pick up in expansion – PSI

17 Sep, 2007

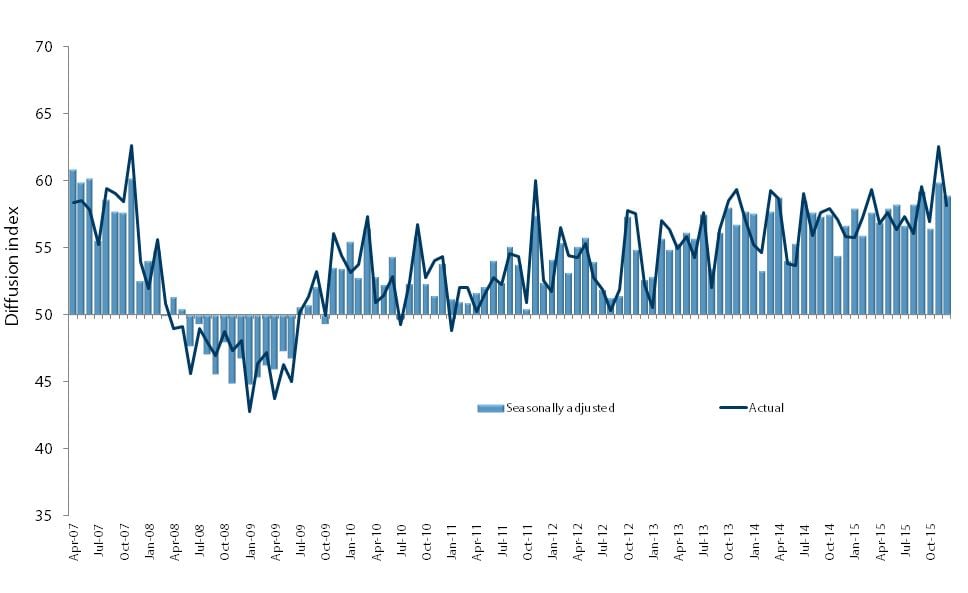
The level of expansion in the service sector last month was the highest recorded since the BusinessNZ Performance of Services Index (PSI) survey began five months ago in April.

The August PSI stood at 59.4, which was up 4.2 points from July, and 0.9 points higher than the highest result previously recorded in May (58.5). A PSI reading above 50.0 indicates that the service sector is generally expanding; below 50.0 that it is declining

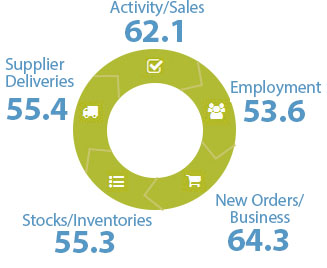
All five diffusion indices that make up the PSI showed expansion in August. New orders/business (65.4) was again the leading index, although showing the second lowest result when compared to previous months. Activity/sales (63.5) recorded its highest value, as did supplier deliveries (56.5) and employment levels (54.4).

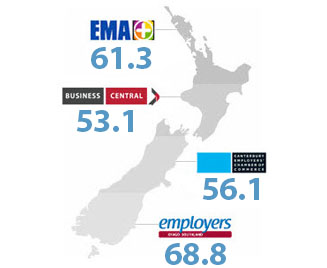
Activity was again very similar across most parts of the country, with only 1.7 points separating the top and bottom values. The Northern region (59.9) continued to display the highest level of expansion for the month.

Most service sectors showed expansion during August, led by wholesale trade (62.6). Health & community services (61.1) were in second place, while property & business services (57.6) continued to slip in terms of rankings. At the other end, accommodation, cafes & restaurants (53.1) showed the lowest level of expansion, although improved from the previous three months.

BusinessNZ chief executive Phil O’Reilly said the strong August result was an encouraging bounce back from a general trend downwards over recent months.

“The high result for activity/sales levels has boosted overall activity, while the lift in the rate of new orders/business expansion should help in ongoing activity towards the last quarter of 2007. However, those in the service sector are continuing to deal with various adverse issues, including higher interest rates and a lack of skilled and unskilled workers”.

The number of negative and positive comments relating to activity for August was almost identical to July (52.7% positive compared with 47.3% negative). In comparison to the same time last year, activity for those with negative comments for the current month had an average score of 3.2 (where 1=large rise and 5=large fall), compared with 2.1 for those enjoying positive activity at present. Overall, the national result for activity compared with 2006 stood at 2.6, slightly down from 2.7 in July.

Click here to view the August PSI & PCI
Click here to view the PSI time series data
Click here to view the PCI time series data

BNZ - BusinessNZ PSI

Time Series Data

View seasonally adjusted and unadjusted time series data for the BNZ - BusinessNZ PSI

Services Landscape

Sponsor Statement

BNZ is delighted to be associated with the Performance of Services Index (PSI) and BusinessNZ.

This association brings together the significant experience of leading business advocacy body BusinessNZ, and business finance specialist BNZ.

We look forward to continuing our association with BusinessNZ and associated regional organisations, and to playing our part in the ongoing development of the New Zealand service sector.

PSI Time Series Table

The results are seasonally adjusted.

BNZ – BusinessNZ PSI Time Series

January 1966 – January 1970

International Results

J.P. Morgan Global Manufacturing PSITM

About the PSI

The BNZ – BusinessNZ Performance of Services Index is a monthly survey of the service sector providing an early indicator of activity levels.

A PSI reading above 50 points indicates service activity is expanding; below 50 indicates it is contracting.

The main PSI and sub-index results are seasonally adjusted.

Technical Contact

Stephen Summers
Economist, BusinessNZ

[email protected]

PSI Releases

Treading water

New Zealand’s services sector continued to display contraction for a sixth consecutive month, according to the BNZ – BusinessNZ Performance of Services Index (PSI). The PSI for July was 48.9 (A PSI reading above 50.0 indicates that the service sector is generally...

Ongoing contraction

New Zealand’s services sector displayed contraction for a fifth consecutive month, according to the BNZ – BusinessNZ Performance of Services Index (PSI). The PSI for June was 47.3 (A PSI reading above 50.0 indicates that the service sector is generally expanding;...

Service with a slump

New Zealand’s services sector continued to show further decline in activity during May, according to the BNZ – BusinessNZ Performance of Services Index (PSI). The PSI for May was 44.0 (A PSI reading above 50.0 indicates that the service sector is generally expanding;...

Declining fortunes

New Zealand’s services sector showed further decline in activity during April, according to the BNZ – BusinessNZ Performance of Services Index (PSI). The PSI for April was 48.5 (A PSI reading above 50.0 indicates that the service sector is generally expanding; below...

Continued softness

New Zealand’s services sector continued to show slight contraction during March, according to the BNZ – BusinessNZ Performance of Services Index (PSI). The PSI for March was 49.1 (A PSI reading above 50.0 indicates that the service sector is generally expanding; below...

BNZ – BusinessNZ
Performance of
Composite Index

PCI Time Series Table

The results are seasonally adjusted.

BNZ – BusinessNZ PCI Time Series

January 1966 – January 1970

About the PCI

The BNZ – BusinessNZ Performance of Composite Index (PCI) takes into account results from both the Performance of Manufacturing Index (PMI) and the Performance of Services Index (PSI). Combined results are shown in two ways:

GDP-Weighted Index:
Apportions the weight of the manufacturing and services index within the economy to produce an overall result.

Free-Weighted Index:
Combines data from both indexes to produce an overall result.

Both time series for the PCI are then seasonally adjusted.

BNZ - BusinessNZ PCI

Time Series Data

View seasonally adjusted and unadjusted time series data for the BNZ - BusinessNZ PCI

Our Contributors

The BNZ – BusinessNZ PSI contains data obtained through BusinessNZ’s regional organisations